
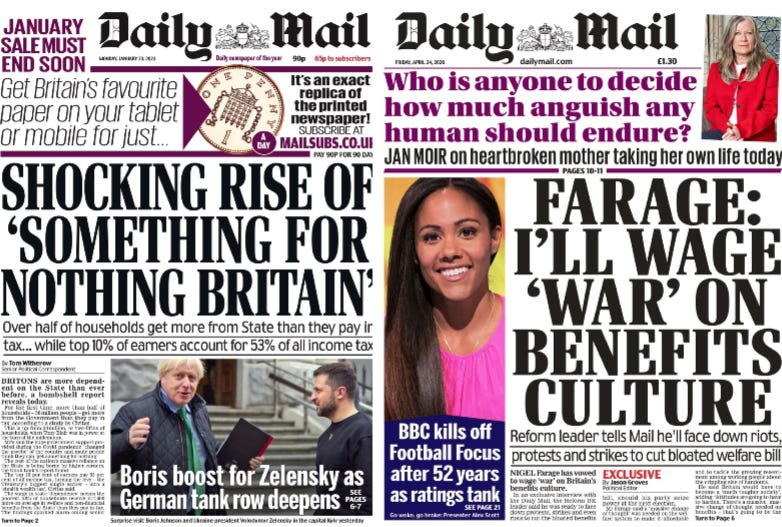
Britain on Benefits
Is Britain's benefits bill really spinning out of control?


We often hear claims about ‘welfare spending’, usually (but not exclusively) from those connected to the political Right. The claims are broadly that:
‘The overall benefits bill is high, rising fast and is now unaffordable.’
‘The state pension system needs confronting because of the unaffordable “triple-lock”.’
‘Broader worklessness has risen a lot, with more working people supporting fewer non-working people (who are of working age)’.
The general theme is that Britain’s benefits bill is now very large against a backdrop of mass worklessness and that this is now a serious drag on the country’s economy.
But is any of that true?
The meaning of ‘welfare’
We first need to get our definitions right. ‘Welfare’ can and should mean any direct benefit payment from state coffers, which therefore includes state pensions. For years, there has been a belief that someone’s national insurance contributions are saved in a big untouched government-sponsored pot throughout their working lives and that pot pays out when you retire.
Except this is not true. State pensions are paid for from general taxation, an element of which has the name ‘national insurance’. But there is no insurance or savings scheme behind that name. Put another way, the money paid in by today's workforce directly funds the state pensions of today's retirees.
The broad definition of ‘welfare’ as direct state support payments (including state pensions) therefore accurately describes what is going on. One can then break down that overall number into its constituent parts to gain a better understanding of how those parts are changing over time.
Unfortunately there is another definition of ‘welfare’ that is a commonly-held one and which is regularly deployed in emotive ways: It is that ‘welfare’ is paid to people who are not working but should be working because they are of working age. Put in Daily Mail terms, such people are ‘not pulling their weight’; they are ‘skivers’ and ‘scroungers’.
It is the weaponisation of this definition that generates shock headlines. But even then, are these weaponised claims true?
Welfare spending in numbers
Let’s focus on the fuller definition of welfare for now - that which includes state pensions - because then we can break it down further to look for particular issues and trends in particular areas (including pensions alone).
Britain’s benefits bill for 2025/26 is £333.7 billion. 55% of this is accounted for by pensioner benefits, so £177.7 billion. Those pensioner benefits include state pensions which make up the lion’s share of that £177.7 billion (82% of it, in fact).
So that’s over half of all welfare spending on pensioner benefits. That means ‘other benefits’ must be covered by the other 45% of the total bill - the remaining £145 billion.
That £145 billion breaks down as follows:
Sickness and Incapacity: £30bn
Extra-Cost Disability: £28bn
Low Income, Unemployment, & Family Support: £52bn
Housing Support: £35bn
These are very big numbers and, while reading this, an instinct can start to simmer that this all seems absurdly high.
But is it?
The way to properly judge these numbers is in relation to the UK’s entire economy which is valued in GDP at just over £3 trillion - £3,061 billion to be precise. When compared to that, the £333.7bn welfare bill amounts to 10.9% of GDP. The only ways to judge that 10.9% figure are:
a) by comparing it to past years
b) by comparing it to other advanced economies around the world.
So the same calculation for the last 25 years in the UK, produces the following:
2000/01: 9.3%
2001/02: 9.5%
2002/03: 9.6%
2003/04: 9.7%
2004/05: 9.8%
2005/06: 9.8%
2006/07: 9.7%
2007/08: 10.0%
2008/09: 10.9%
2009/10: 12.1%
2010/11: 11.9%
2011/12: 11.8%
2012/13: 11.8%
2013/14: 11.3%
2014/15: 11.0%
2015/16: 10.8%
2016/17: 10.6%
2017/18: 10.4%
2018/19: 10.2%
2019/20: 10.2%
2020/21: 12.8%
2021/22: 11.1%
2022/23: 10.5%
2023/24: 10.6%
2024/25: 10.7%
2025/26: 10.9%
So the range for 25 years has been between 9% and 13%. The most recent figure of 10.9% is right in the middle of that range. It is clearly not stupidly high and/or rising out of control. Setting aside external crises - you can see the effects of the global financial crisis from about 2008, and Covid from 2020/21 - the OBR is currently forecasting the figure to be 11.2% in 2030/31.
One can therefore say this key percentage appears to be rising a bit in what are considered to be relatively quiet economic times after Covid.
But the calculation of ‘welfare as a percentage of GDP’ requires two elements: welfare spending and GDP. If the economy is functioning in a sub-optimal way, then that can also have the effect of pushing up the percentage. The denominator (the GDP number) may not be keeping pace, and there is certainly plenty of evidence of that. Britain has had a productivity problem for years. It suffered from its outsize exposure to financial services during the global financial crisis, and Brexit has proved to be like a ‘slow puncture’ in the economy.
The overall welfare bill may therefore not be the problem here, but having said that, let’s continue pursuing welfare spending for the purposes of this article.
The other way to judge the UK’s welfare spending as a percentage of GDP is by comparing us to other advanced countries. Here is a sample:
Italy: 17.0%
France: 16.5%
Germany: 12.3%
Japan: 11.4%
United Kingdom: 10.9%
OECD Average: 10.2%
Canada: 8.4%
United States: 7.1%
The UK is therefore quite close to - but a bit above - the OECD average. Most European economies spend more than we do and tend to have better welfare support systems. The USA spends less but is well known for having a much more limited welfare support system.
It seems that total welfare spending in the UK is about average internationally (and really quite low for a European state); it is within normal bounds domestically; and it is quite stable over time.
What, then, is the problem?
Here is how the 10.9% breaks down into its component parts, and indeed how those component parts have changed over time, courtesy of the Resolution Foundation:
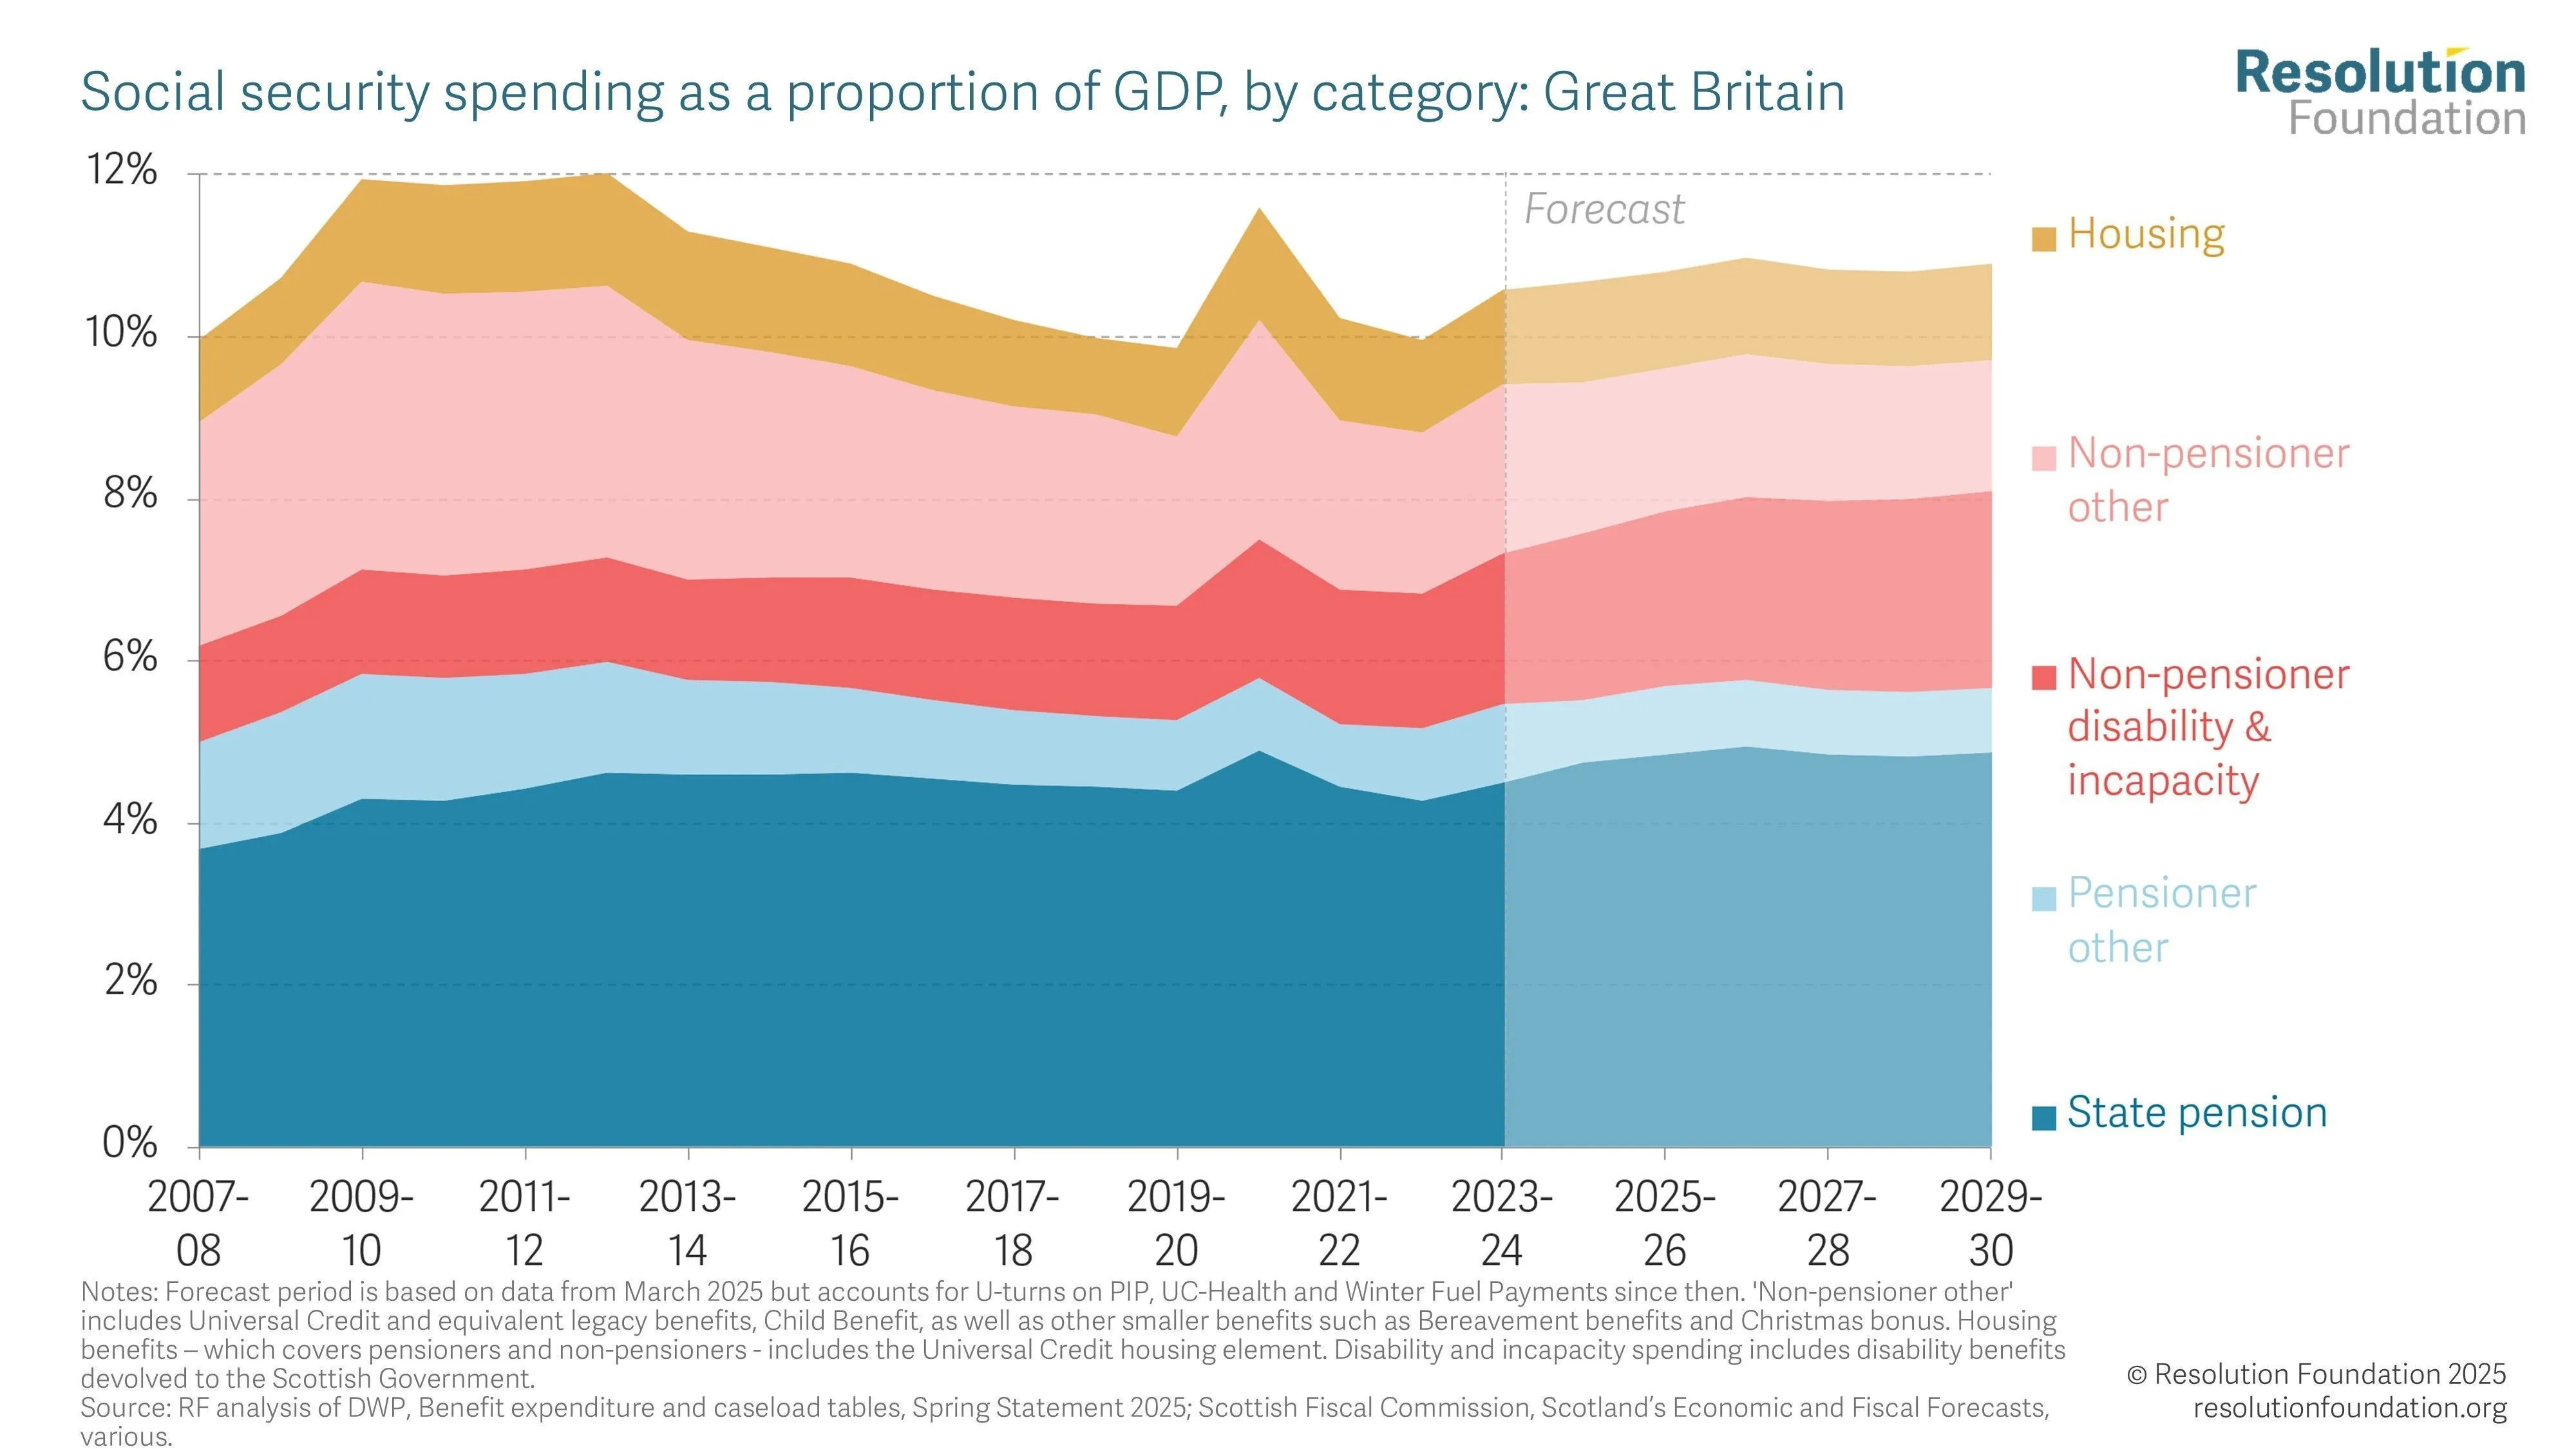
From this, we can see the spending components that have grown over time are state pensions and ‘non-pensioner disability and incapacity’ benefits. The spending growth in those two areas has been compensated by shrinkages elsewhere, which has enabled governments to keep total spending fairly stable over time.
Nonetheless, we need to dive into those two growth areas.
State Pensions
State pensions (and other less costly pensioner benefits) are clearly growing as a proportion of the overall welfare bill, now accounting for 55% of the total welfare bill. But in the early 2000s, this figure was around 40-45% so it has grown in relative terms.
But this growth has been long predicted because we always knew the high-number of Baby Boomers and GenX people would eventually retire. These same cohorts prompted more schools to be built in the 1960s and early 1970s. Indeed those born in the 1960s (late boomers/early GenX) are just beginning to hit state pension age this year. The state pension bill was only ever going to go up but so were the number of ‘workless’ people, which includes early retirees not yet eligible for the state pension - more on ‘worklessness’ later.

This is why the so-called ‘triple lock’ - guaranteeing that the state pension keeps pace with the general cost of living - is starting to be questioned in Westminster. It is not because the triple-lock is itself a bad formula - indeed, some suggest those on the state pension would be better off today had the old formula continued - but it is becoming a proxy for a more general concern about the growing pensions bill.
It almost goes without saying that addressing/restraining the state pensions bill is probably not what Daily Mail readers had in mind when reading the shrill ‘Benefits Britain’ headlines above. But there’s a very real danger that pensions will get caught in any ‘slashing benefits’ crossfire; an interesting prospect considering it is voters over 50 who seem most receptive to Rightist narratives on stopping Benefits Britain.
The other thing to say about the triple-lock and the emerging narrative of state pensions becoming unaffordable is that when comparing the UK to other European countries, it becomes very clear that we are not even close to overspending on state pensions. One could even argue we are underspending. And this comparative situation is unlikely to change much while those born in the 1960s move through old age.
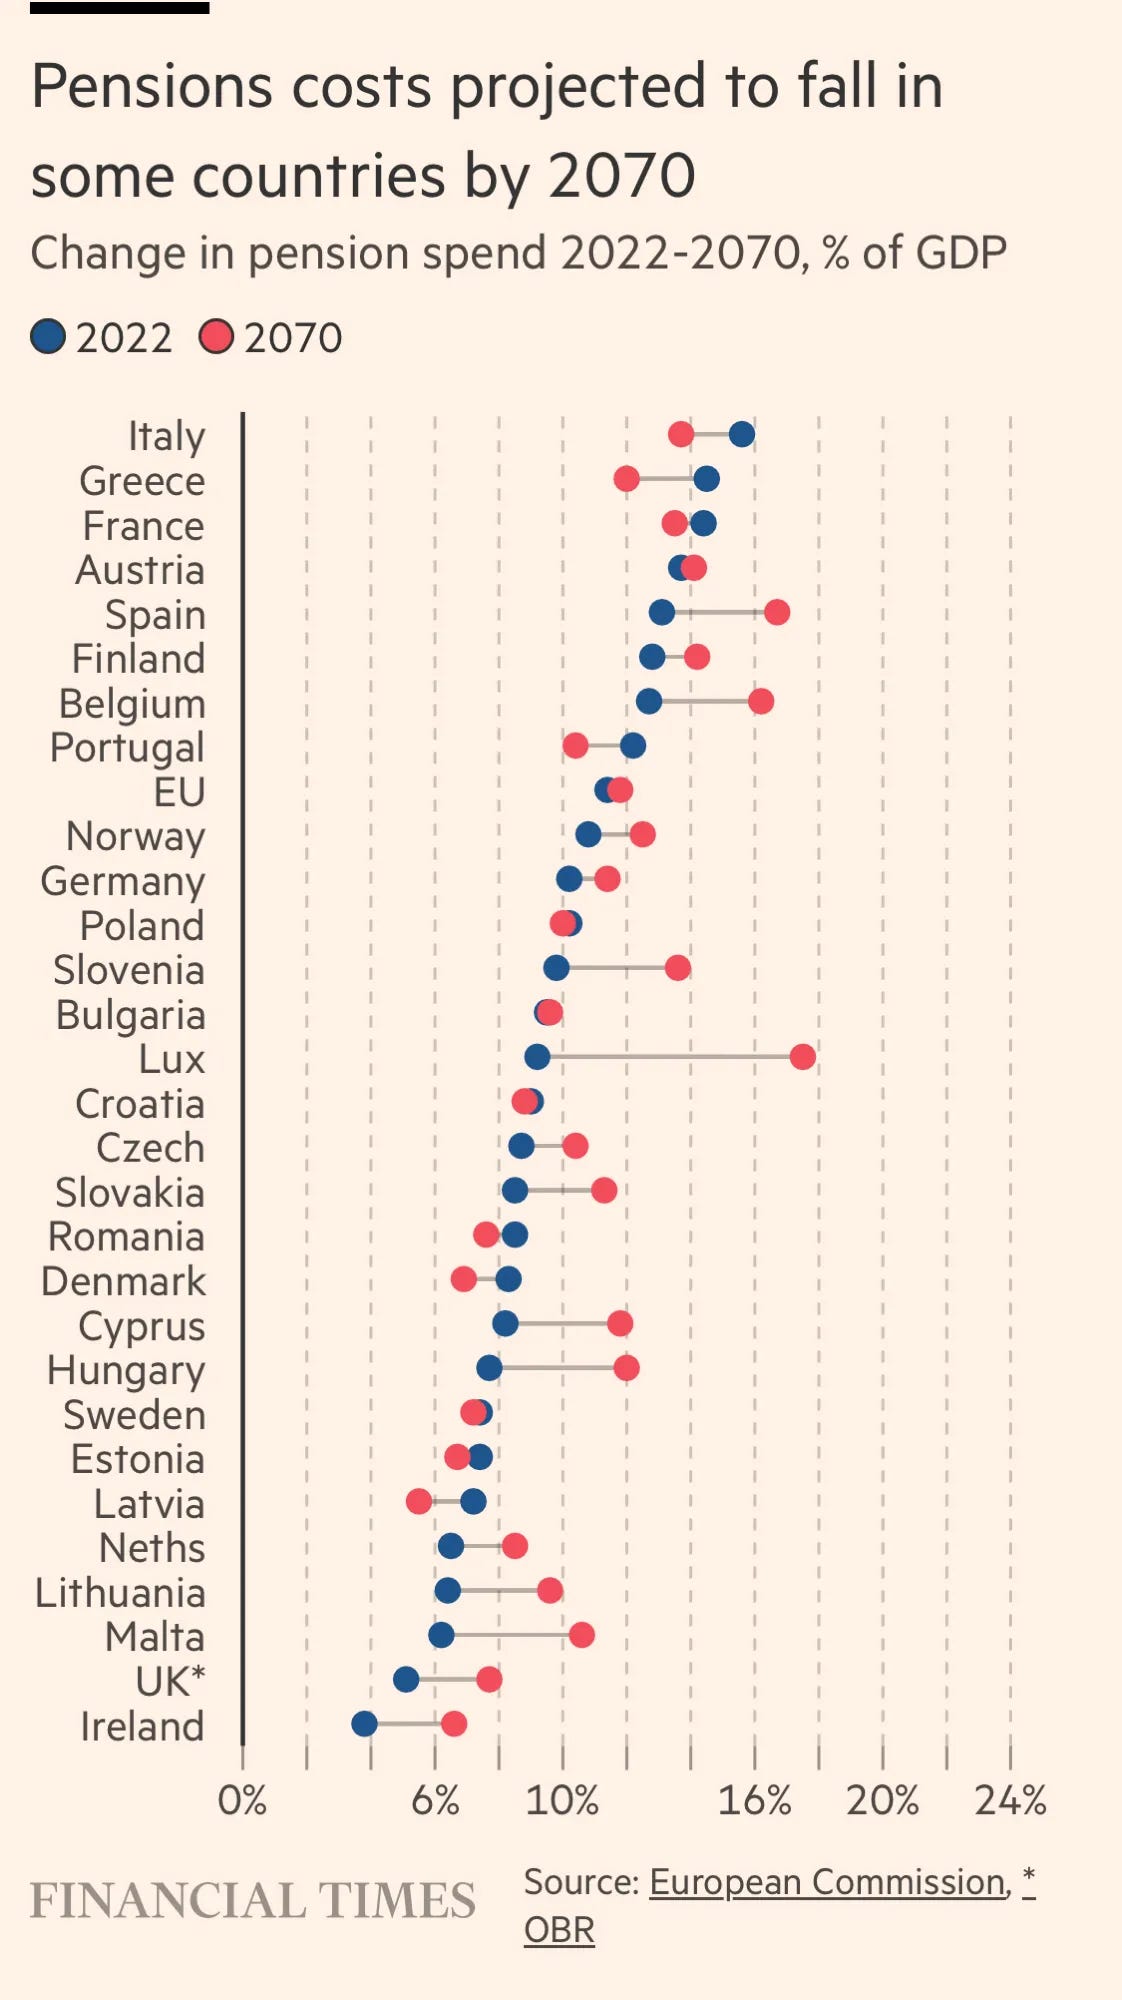
The children of the 1960s are luckier than pension-doom narratives might suggest, because there is a further bulge of younger working people who were born in the 1980s and 1990s who will help sustain the economy and tax receipts as the 1960s-born go through old age.
Beyond that, though, when the 1980s/1990s cohorts come to retire, things are likely to get trickier, because the birth rate since 2015 has reached a historic low. The way to help that looming economic problem is of course to attract more young migrants. But the narrative in Britain is currently doing the precise opposite - it’s all about deterring migrants, and even to lower the population of migrants already here.
The 1980s-born and 1990s-born cohorts - those under 45 - need to ‘take back control’ of the migration narrative from Boomers and GenXers.
Sickness, Disability & Incapacity Benefits
The other area of expansion within the overall (stable) benefits bill, is that of sickness, disability and incapacity benefits. This is more promising territory for both the Daily Mail and for the Right more broadly, because there is a view among them that, crudely, ‘malingerers be here’… and therefore savings too.
The two components we are looking at here (of the £145 billion of non-pensioner benefits) are:
Sickness and Incapacity Benefits: £30bn
Extra-Cost Disability Benefits: £28bn
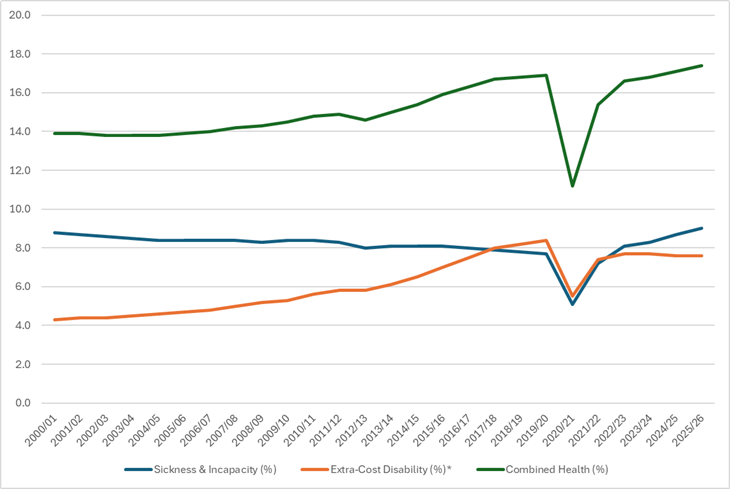
So £58bn on benefits relating to poor or impeded health, or about 17% of the entire benefits bill (of £333.7bn). A fairly significant chunk of this has been rising, even before the pandemic, and ‘Extra-Cost Disability Benefits’ have been the big driver of the rise over the last 25 years. By contrast, Sickness and Incapacity Benefits have been quite stable over that period, albeit with a rise in just the last few years.
So what are ‘Extra-Cost Disability Benefits’? These break down into:
1. Personal Independence Payments (PIP): £22.6bn. This is the main driver of the overall rise. PIPs support working-age adults (aged 16 to state pension age) who face daily living or mobility challenges.
2. Disability Living Allowance for children (DLAC): £4.4bn. This covers children under the age of 16 and is paid to parents or guardians to help meet the extra costs of raising a child with a disability or long-term health condition.
3. Devolved Scottish Disability Benefits: £1.0bn
PIP is therefore a very large part of the story here. PIPs were introduced by the austerity-driven coalition government in 2013 to replace the Disability Living Allowance or DLA. Prior to the PIP being introduced, the DLA used to consume about 5% of the overall benefits bill. The PIP system was meant to reduce that but it has clearly failed in that objective, having now reached 6.7%.
Why?
The rapid rise in the PIP bill seems overwhelmingly rooted in worsening working-age mental health e.g. severe anxiety, clinical depression, and mood disorders, and with a rising tide of young claimants who come with quite a significant prevalence of Autism and ADHD. Indeed for the youngest cohort of claimants (ages 16 to 24), the combined share of anxiety, depression, autism, and ADHD listed as the primary cause of a claim has risen from 49% in 2020 to 64% now.
Eureka? Have we ‘got there’? Is it the brewing Autism/ADHD culture war (see my perspective on Autism/ADHD here) and how we treat such people which is the real core of any welfare conversation? This is probably why some voices on the Right kick against the wave of Autism/ADHD diagnoses: not really because there may be conversation here about the outcomes of such diagnoses, but there is a clear welfare benefits angle to it, which, given the young ages of claimants, threatens to go on for decades.
However, it is not quite a Eureka moment that’s solely about Autism/ADHD. There are multiple issues with the design of the PIP system which could be said to have provided incentives to claim. The recent Milburn report highlighted at least ten, only one of which was: ‘Autism, ADHD, anxiety and depression fluctuate and should not automatically trigger a verdict of unable to work.’
As for the other big category of ‘Sickness & Incapacity Benefits’ which have been rising in the last few years, there are a couple of theories as to why:
The very extended length of NHS waiting lists, especially since Covid. These waiting lists have a direct impact on people’s health and ability to work, which then prompt health-related claims. ‘Everything is connected’.

The squeeze on benefits elsewhere, especially on universal credit, making living an even basic lifestyle more difficult. This has created a perverse but understandable incentive to get a ‘too ill to work’ benefit to be able to live slightly better. Of course this occasionally generates a sensational media story of a benefit claimant who is supposedly immobile being photographed running around on a foreign beach.
Covid had a massive effect on the operation of the health service, but throughout this article, I have barely mentioned Covid and its direct effect on individuals. Long Covid claims, as the primary reason for the claim, are relatively few. The current estimate is about 6,000 active claims. However, there is a belief that post-viral illness may underlie other claims, but it is not listed as the primary factor.
It sounds like an attractive explanation. And yet there is a problem in heading down the road of thinking Covid has scarred many people and thus driven health claims upwards in recent years. That problem is the fact that nearly all other European countries have not tracked the UK’s post-Covid/health claims experience. In fact, the UK is a major outlier.
No, any issues we have are much more likely about the UK’s integrated or not integrated system of incentives, of individual benefits, and of a creaking post-Covid healthcare service.
The rest of Europe shows us there can be another way to manage societal health and related parts of the benefits system more effectively. I’m not going down the road of arguing for a more European model of healthcare, but it is a debating point that does hover around this subject.
So are we, overall a benefits-dependent society? No, we are not. There are always conversations to be had in this arena and they are the very stuff of political debate, but, as always, it doesn’t warrant the shrill and downright inaccurate nonsense we are often subjected to.
A word on ‘worklessness’
I suggested at the start that I would address the alleged problem of ‘worklessness’, in which it is claimed there are rapidly rising numbers of people who either say they can’t work or don’t want to work.
This is not wholly a benefits story as we shall see.
The official definition of ‘workless’ consists of:
The Unemployed. People who do not have a job but are actively looking for one.
The Economically Inactive. People who do not have a job but are not looking for one. This includes the long-term sick, students, early retirees, and full-time or look-after-family (unpaid) carers.
The ONS puts the percentage of adults in this definition at 25% (in 2026), and this figure has been stable (plus or minus 0.7%) since 2016. In the 15 years before 2016, it was higher, averaging around 27% and almost hitting 30% in 2011.
Over the long view, the number of ‘workless’ is not therefore high or rising rapidly.
The Economically Inactive part of the ‘workless’ definition makes up a huge proportion of the 25% who are ‘workless’. In fact, there are now roughly 9.1 million economically inactive people (so 20%) compared to about 1.8 million who are unemployed (the remaining 5%).
The definition of ‘workless’ does not therefore automatically mean ‘work shy’ or ‘malingerers’, as some would have you believe. Far from it. There are many people included in the definition who are not considered (by the Daily Mail) to be a problem when pondering who has not got a job - most notably, people who have retired before their state pension age using their own private pension/savings resources, and full-time students. In other words people who don’t claim benefits. Carers may sometimes do so.
The full Economically Inactive group breaks down as:
Students: 2.3m
Early Retirees: 1.1m
Full-time carers/Look-after-family: 1.6m
Long-term sick: 2.8m
‘Others’: 1m
(The shortfall when adding these up is caused by rounding errors.)
The long-term sick sub-group is a key part of the sickness/ incapacity/ disability benefits story covered above. Which means the remaining part of the Economically Inactive group is significantly represented by those who generally do not claim benefits - most notably students and early retirees. And I mentioned much earlier that the Early Retirees sub-group is going to rise in the next few years, as those born in the 1960s retire before state pension age, which for most of them is age 67. Indeed some of those that could retire early, retired from age 55 during Covid, because the pandemic experience changed those people’s perspectives of life. That phenomenon was even picked up in the stats at the time.
I’m a 1966-born, GenX recent retiree, and I absolutely fit into that economically inactive sub-group. Increasingly, so do the rest of my peer group, and this is likely to continue over the next three years as some of us find we can actually retire - in a few cases by bludgeoning the maths until they submit. But, well, that’s quite another story.
Conclusions
Despite there being no ‘benefits crisis’ in Britain - just a conversation about some areas such as PIPs - we are still faced with the Right shouting about reining in welfare spending. Why?
The story is really not about welfare at all; it’s about tax and about wanting to lower the tax burden. And that is a whole other story, told well by tax expert Dan Neidle.
We might just be ‘running out of other people to tax’, which politically means trying to rein in welfare spending instead.
Politics, eh.
This is a really useful corrective to the “Benefits Britain” framing. The key point, for me, is that the welfare debate is often made to look like a moral problem, when much of it is really a systems problem: ageing, ill-health, housing costs, NHS waiting lists, insecure work and weak prevention.
From a Scottish angle, I think this connects directly to the wider question of prevention infrastructure. If housing, poverty, work, transport, care and local services are failing, the NHS and social security system end up carrying the cost. The debate should be less about blaming people for needing support, and more about asking why so many people are being made ill, insecure or unable to participate in the first place.